 Stone Mountain Corporation
Re$erve Studies
Stone Mountain Corporation
Re$erve Studies

CHARTS & GRAPHS
"A chart is worth 1000 words..."
At least that is often the case with reserve studies. Reserve study charts are most effective when they simply depict the interplay of expenses versus reserves over time so that members can easily understand their association's financial picture.
Including a page of reserve analysis charts in your annual budget mailing to your membership is an effective way to help convince your members why you need to increase (or decrease) your reserve budget.
There are many ways to present reserve study results in graphic form and unnecessarily complicate a reserve study. But the key data most people want to see is expenses versus reserves. Some reserve studies show one or the other on separate bar charts, but not both together.
In our reserve studies, we show two "expenses versus reserves" bar charts, essentially depicting "before" the reserve study and "after" the reserve study. When viewing the bar chart, you can quickly see if the association's reserve budget needs adjustment.
The following bar chart represents a projection of the current reserve budget against projected reserve expenses ("before" the reserve study recommends a reserve budget). As you can see, the reserve balance goes negative several times in future years, indicating that there is a need to raise reserve funding. The current reserve budget shown is $32,500 for a 40-unit association.


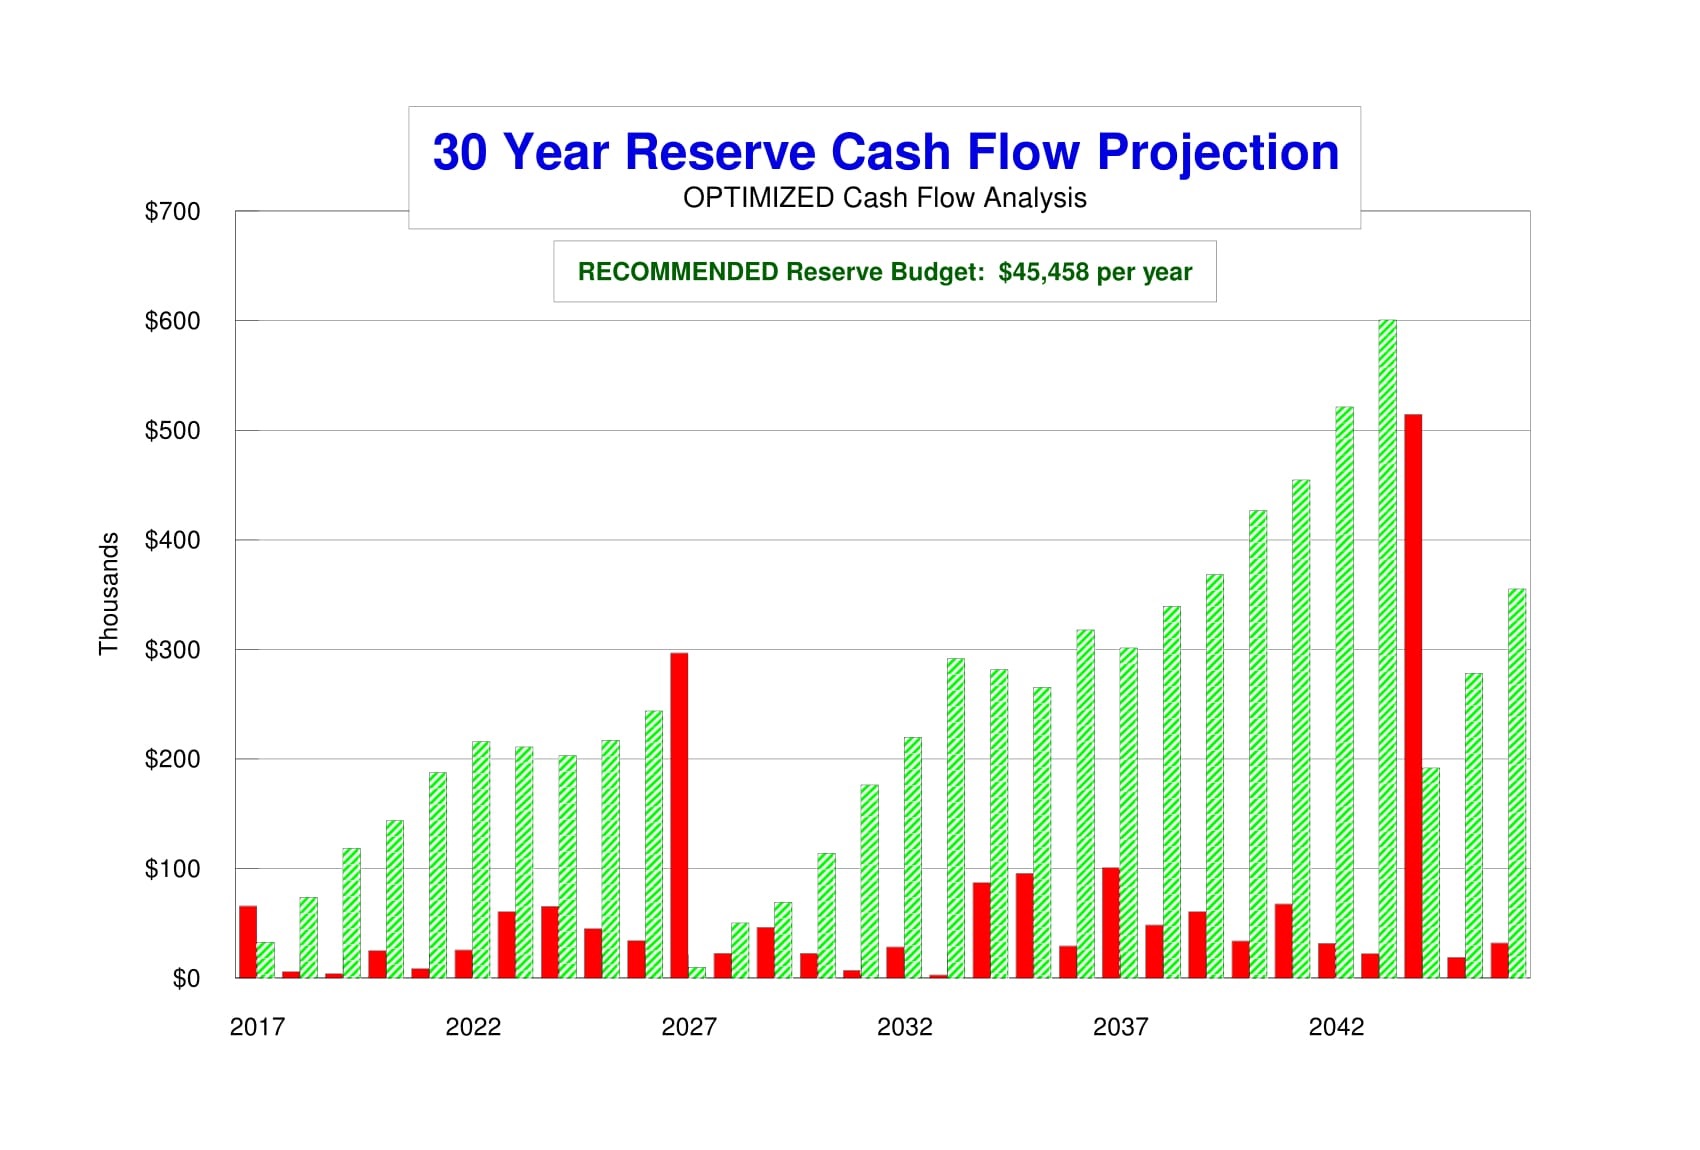
OPTIMIZED CASH FLOW ANALYSIS
This next chart shows projected reserve expenses versus reserve balances after our proprietary SmartRe$erve™ software uses its optimization technique to find the optimal annual reserve funding amount such that your reserve balance doesn't go below zero in any of the next 30 years, based on projected reserve expenses.
Usually in any 30-year cash flow projection, there is one year in which the reserve balance goes the lowest. This occurs in a year when several large expenses happen all at once. We refer to that year as the "critical year" in the 30-year projection because that year is the determining factor in the optimization analysis.
Some associations prefer to have our SmartRe$erve™ software optimize the reserve funding amount such that the lowest projected reserve balance is zero dollars. This is called Baseline Funding." Most associations prefer to specify that a minimum reserve balance be maintained throughout the 30-year projection in the event of unforeseen reserve expenses. This is called "Threshold Funding."
In the example below, the client specified that they wanted to maintain a minimum reserve balance of at least $10,000 during the 30-year projection. As you can see, that minimum occurs in Year 2027, so Year 2027 is the "critical year" in the projection.
Finally, note that the recommended reserve funding is $45,458 per year (compared to the current reserve funding of $32,500 per year):
Return To Top